Annual Report 2011
- Corporate Social Responsibility
- Environment
- Calculation of Abengoa’s main environmental indicators
Calculation of Abengoa’s environmental indicators takes into account work facilities, their associated activities, and all projects promoted directly by the company.
Taken into consideration for other projects were the main figures deriving from company operations, excluding raw material inputs, consumption and waste attributable to the developers of these projects, and likewise excluding activities involving maintenance or operation conducted at customer facilities and procurement between Abengoa companies.
With the aim of improving the reliability of the environmental indicators, improvements were made to the process of compiling and aggregating data using a computer application. Some values from previous years were rectified in accordance with the revised classification, estimation and computation criteria.
All indicators were computed on the basis of specific protocols for measurement and calculation with the aim of standardizing application criteria. Policies were also developed to reduce paper, toner, water and office electricity consumption, and to collect waste for subsequent treatment or recycling.
Due to the nature and variety of Abengoa’s activities, and given that it does not make sense to provide a comprehensive list of each and every item, shown are the most relevant items associated with the different environmental aspects. For this reason, available data were aggregated and consolidated so as to give a real and adjusted picture of the company’s environmental impact according to the different activities conducted.

Environmental impact control, awareness, and minimization
The following, among others, are some of the most significant activities that have been carried out in order to minimize environmental impacts: prevention-related initiatives, environmental management, effluent and waste inspections, internal and external audits, certification by authorized entities, employee training, and the use of clean technologies.
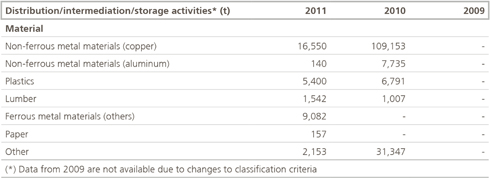
Raw material inputs
Below is a list of raw material inputs used according to activity.
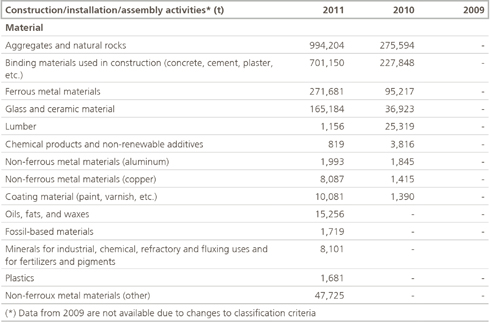


The percentage of the total amount of materials utilized that are materials that have been valorized was 6 %.
Also taken into account are materials processed by companies dedicated to waste recycling through waste treatment, valorization, and recovery.
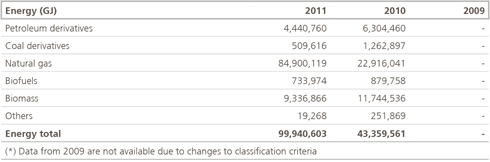
Energy
Listed as important elements under direct energy consumption are fuels consumed in the different industrial processes, including grain dryers, smelting furnaces, machinery, etc., and in the production of electrical power at cogeneration plants.
The rise in energy consumption in 2011 with respect to 2010 is primarily attributed to start-up of operations of new plants fuelled by natural gas.
Data on the amount of electrical power grid consumption corresponds to permanent work centers, including both production facilities and offices, and to those projects promoted directly by Abengoa.

If we transform this electrical consumption to the primary sources utilized for generation according to IEA data for the different countries where Abengoa operates, the result is as follows:
Energy produced and sales in 2011 is disclosed as follows:
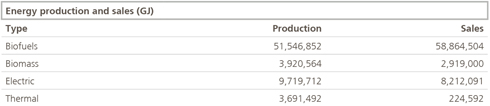
The difference between the biofuel that is produced and sold is due to the purchase of gasoline for the production of different commercial mixtures of ethanol and the buy-sell transactions undertaken throughout the year to meet some specific peak demand of bioethanol.
It should be noted that 14 % of the production of this energy is of solar origin.
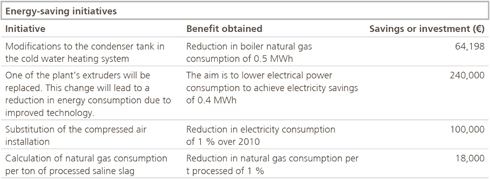
The table below shows the results of proactive efforts to increase energy efficiency through technological process enhancements and other savings measures realized in 2011.
Initiatives were in turn implemented with the aim of lowering indirect energy consumption. These initiatives involve business travel and commutes to and from work facilities and include, for example, facilitating bus service for employee transportation, and efficiently managing the supplier portfolio.
A variety of initiatives were carried out over the course of 2011 aimed at providing more energy-efficient products and services.

Water
According to Abengoa’s information system, none of the sources used to collect water is on the Ramsar list of wetlands or may be considered especially sensitive. Nor is there any record of cases in which annual consumption totals more than 5 % of the volume of the sources affected.
The company’s policy on sustainability prioritizes reduction at source by minimizing the amount used or through reuse of the resource for activities in which potability is not a key factor.
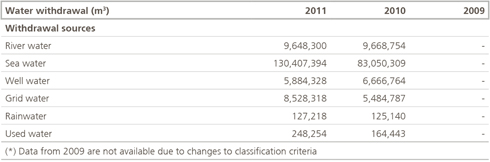
The increase in sea water withdrawal is due to the operational start-up of a variety of desalination plants.
The amount of recycled and reused water totaled 1,211 hm3, which amounts to 782 % of the total volume of water collected at Abengoa.
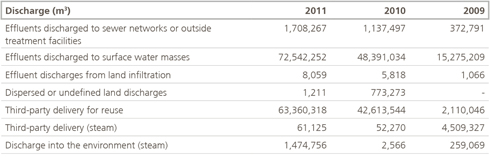
Wastewater discharge and spills
In companies in which, due to the nature of their business, the state of water utilized is negatively altered, suitable treatment is undertaken, with final quality being within the limits established under legal requirements, prior to discharge into a public water source.
All discharge operations are likewise authorized and controlled by the pertinent authorities.
No significant accident spills were reported through the reporting channels in place in 2011, with other spills (oil, residues and chemical substances) entailing a total cost of below 10 k€.
No water resources or habitats affected by spills deriving from company activity were identified through Abengoa’s reporting system.
Waste
As part of its normal course of business, Abengoa generates many different types of waste, most of which are monitored through the different environmental management systems implemented in each company. Here the most significant are shown according to final destination.


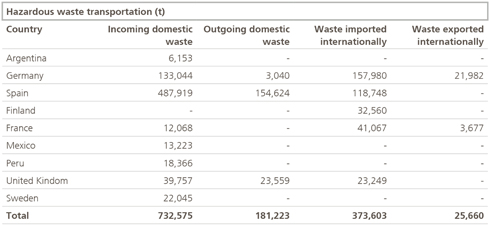
In accordance with our environmental management policy, all companies that generate hazardous waste conduct an exhaustive process of identifying and monitoring these types of waste and their quantities in all operations involving transportation to authorized agents, whether they belong to Abengoa or to outside companies.
Emissions
The results of the Abengoa Greenhouse Gas (GHG) Inventory in 2011 provide a complete picture of the emissions derived from company activity; a structured analysis according to the scopes and different sources, which also includes emissions from biomass operations and the differences. This inventory was accordingly disseminated out of a desire for other companies to also be able to situate their climate change policies at the core of their activities and interests.
Computation of GHG emissions took into account the direct emissions of all sources under the possession of Abengoa (combustion, process, transportation and emission leaks), indirect emissions from electrical power, thermal energy and acquired steam and the indirect emissions resulting from work commutes, losses in the distribution and transmission of electrical power, and emissions in the value chain of fuels consumed for generating acquired electrical power. Emissions linked to biomass combustion or processing are likewise reported.
Emissions are calculated in accordance with the methodologies of the Intergovernmental Panel on Climate Change (IPCC) and the GHG Protocol, using, whenever possible, specific fuel emission factors; and in other cases, national GHG inventory values of the countries in which Abengoa activities are carried out, and, as a last resort, generic figures published by the IPCC.

For Abengoa, the Greenhouse Gas Emissions Inventory is an instrument for ensuring responsibility and efficiency in the struggle against climate change.
In contrast to other techniques for analyzing the local carbon footprint, the complete accounting of emissions engages all Abengoa companies, in all geographies.
Emission measurement in the Abengoa inventory has clear advantages over other instruments: it is thorough, in terms of both the consolidation perimeter and scopes; it is verifiable both internally and externally; it constitutes a global model upon which to base reduction targets; and it binds suppliers to climate preservation policies.
Abengoa requires group companies to draw up annual emissions reduction plans. As a result of the proposed emission reduction initiatives, a reduction totaling 257,673 t of CO2 over the 2010 GHG Inventory was estimated for 2011.
Taken into account in carrying out emissions accounting was variation in business, a factor that has a significant distorting effect on results. Thus, a company whose activity increased this year with respect to the previous year will also show a rise in its emissions levels. For this reason, success in fulfilling reduction plans lies in ensuring that the rise in emissions stays below the activity increase.
In order to eliminate this distorting effect, instead of carrying out a comparative study of emissions from one year with respect to emissions in the previous year, Abengoa conducts a comparative analysis between ratios: tons of CO2/activity.

Listed below are some examples of the most significant initiatives carried out over the course of 2011.

In addition, the development of specific methodologies was completed over the course of the year for labeling the emissions associated with the following products and services:
- Steel structure.
- Solar thermal kWh.
- Photovoltaic kWh.
- Waelz Oxide.
- Ferrosite.
- Waste treatment.
- Recovered aluminum (secondary).
- Bioethanol.
- Exported electricity, generated steam, and water desalinated in cogeneration plants.
- Sulfuric acid, oleum, and electricity generated in desulfurization plants.
- Desalinated water.
There has been no record via the Abengoa reporting channels over the last three years of any significant emissions of ozone layer-depleting substances deriving from company activity.
Emissions reported in 2011 are listed below.
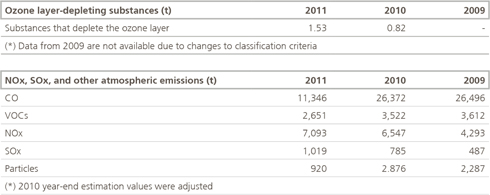
2010 figures were adjusted using year-end estimates.
Managing biodiversity
Abengoa understands that a sound strategy for preserving biodiversity requires a combination of elements involving prevention, management and restoration of any damage that may be caused to the natural habitats in which the company operates.
Keeping this aspect in mind at all times, environmental impact studies and monitoring tasks were carried out on the activities being conducted on land adjacent to or lying within protected areas, including the identification of affected species, as well as quantification and assessment of derived impacts (Appendix C, tables I, II).
Conservation of these habitats is an objective that encompasses recovery and reforestation plans, strategies geared towards protecting plant and animal species, and training in forest fire prevention, etc. (Appendix C, tables III, IV).
Products and services
Integration of environmental considerations associated with product and service design helps to lower risk and mitigate ensuing environmental impacts. A design that is favorable to the environment helps us take a more proactive stance in mitigating the level of product and service impact, identifying new business opportunities, and boosting technological innovation.
In certain activities, the environmental impacts of products and services that occur during utilization and at the end of their useful life may be of equal or greater importance than those resulting from manufacturing and pose an ever growing environmental challenge. In this regard, no significant impacts derived from transportation of products or other material goods used for company activities or in transporting personnel were identified through the Abengoa reporting system. Nor were any significant quantities of recovered products, containers or packages identified.
Environmental expenditure
Measuring the expenses related to environmental mitigation and protection helps Abengoa to determine the efficiency of its environmental initiatives. The following is a list broken down into rectification-related expenses and environmental expenses involving prevention and management.

In 2011, Abengoa reported four infractions related to inadequate management of hazardous waste occurring in 2010 in Murcia, with the total amounting to € 330,557. There have been no reports at Abengoa of any other incidents.
In 2011, the Swedish Environmental Protection Agency confirmed that Befesa Scandust would be fined SEK 12,149,785 (roughly EUR 1,185,576) for its failure to present its emissions balance sheet for 2006 in due time, caused in turn by a computer malfunction. Various Swedish companies struck with the same fine have lodged an appeal before the Court of Justice of the European Union. Befesa is currently considering following suit.
© 2011 Abengoa. All rights reserved