 Abengoa
Annual Report 2012
- Activities
- Main figures
Main figures
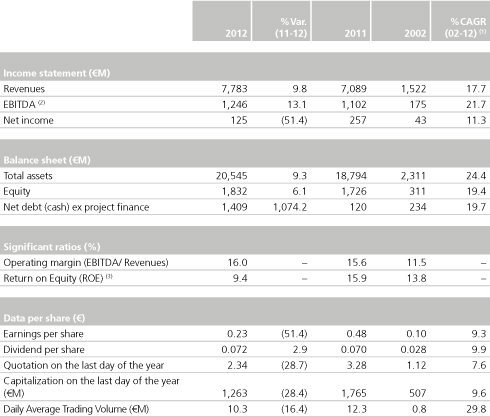
During the period 2002-2012 Abengoa’s revenue has been growing at a compound annual rate of 17.7 %, the ebitda by 21.7 % and earnings per share by 11.3 %.
Economic – Financial Data

(1) CAGR: Compound Annual Growth Rate.
(2) EBITDA: Earnings before interest, tax, depreciation, and amortization.
(3) Net Earnings/ Shareholder’s funds.
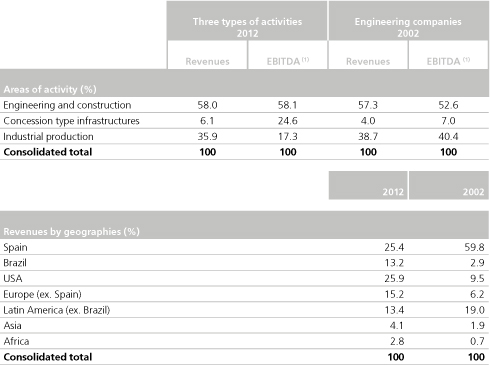
Types of activities & geographies
Evolution 2012 – 2002 (%)

(1) EBITDA: Earnings before interest, tax, depreciation, and amortization.
© 2012 Abengoa. All rights reserved