
This website uses third-party cookies to collect statistical information related to your navigation. If you continue to browse, we consider you accept this use. See more information on our cookies policy here.
Annual Report 2012
- Corporate Social Responsibility
- Environment
- Greenhouse Gas Management System
Abengoa has been computing the greenhouse gas (GHG) emissions associated with its products and services since 2008 through a management system designed by the company for this purpose and integrated into the ISMS.
This application incorporates emissions accounting for all scopes and sources established under Abengoa’s internal norm governing the inventory, which was devised in accordance with international standards. The GHG emissions inventory has been published in the Carbon Disclosure Project (CDP) since 2009.
The aim of this system is to gain in-depth knowledge of the direct and indirect GHG emissions of each and every company activity. This emissions accounting also aids in setting annual reduction targets, labeling Abengoa products and services, and in evaluating suppliers according to the GHG emissions linked to the products and services they provide.
In addition to signing the Abengoa Social Responsibility Code (SRC), all Abengoa suppliers are required to sign the Greenhouse Gas Emissions Reporting System Implementation Agreement. The GHG management system requires all Abengoa companies to obtain emissions reports from every supplier and has incorporated this requirement as a critical criterion in contracting the provider, thus helping to convey good practices in sustainability and in the fight against climate change across the supply chain.
To date, more than 16,300 agreements have been signed worldwide.

Since 2011, Aenor annually verifies the Abengoa system used to manage the emissions attributable to operations over which the company has control in accordance with the specific requirements contained in Section 7.3 of the ISO 14064-1 standard.
Provided below is the quantitative information included in the GHG emissions report that was verified by Aenor for this year:
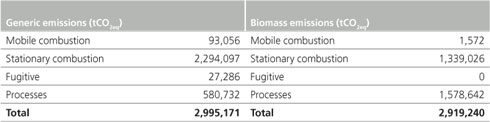
Scope 1 emissions
Listed below are the Greenhouse Gas emissions occurring in Abengoa’s own sources or those under the control of Abengoa by source, differentiating between emissions associated with biomass and emissions associated with other productive processes at Abengoa.
Stationary combustion is the most important emission source associated with productive processes. In relation to biomass, also significant are emissions linked to the processes involved in producing bioethanol.
Emissions by GHG type
Listed in the tables below are Scope 1 emissions; that is, emissions generated at Abengoa’s own sources or those under the control of Abengoa, showing a breakdown by greenhouse gas type as defined under the Kyoto Protocol:
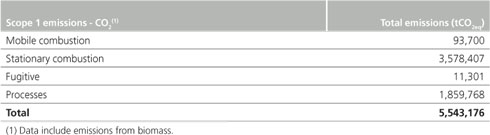
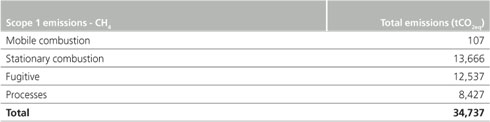
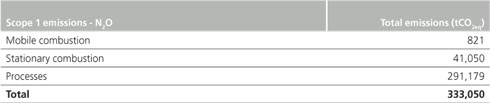
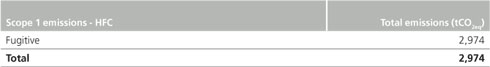
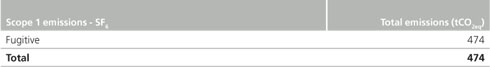
Note: No PFC emission sources were identified.
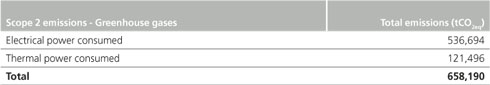
Scope 2 emissions
Listed below are the emissions from electricity and thermal energy generated by other entities and acquired and consumed by Abengoa for its entire range of operations.
Scope 3 emissions
Finally, shown below is a breakdown of indirect emissions resulting from company activities but which occur at sources that are neither owned nor controlled by the company.
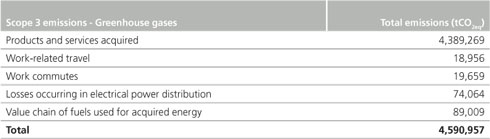
Abengoa understands the importance of reducing impacts in the company value chain, and therefore year after year the company makes a significant effort to measure its carbon footprint along the value chain, especially in the case of emissions associated with acquired products and services.
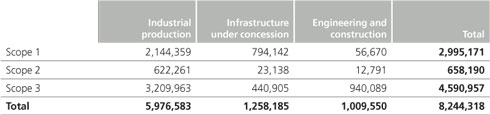
GHG emissions by business sector
Given that Abengoa structures its business around three industry segments: Industrial production, Concession-type infrastructure and Engineering and construction, shown below are data on emissions for each one of these segments according to each one of the three scopes:
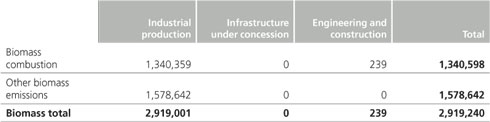
Emissions from biomass are as follows:
Historical log of GHG emissions
The table below shows a summary of Abengoa’s GHG emissions listed in all published inventories:
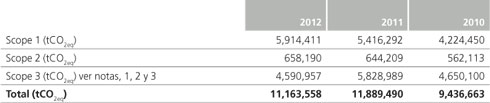
As a product of Abengoa’s efforts to reduce the carbon footprint of its activities, it can be seen that the increase in Scope 1 and 2 emissions is lower than the increase in revenues, obtaining a better emissions intensity ratio in 2012. In addition, Scope 3 emissions have dropped as a result of the effort made in conveying the importance throughout the value chain of reducing the carbon footprint of activities that are not under the control of Abengoa.
Note 1: Scope 3 data shown in the table include emissions associated with work-related travel, work commutes, losses in the transmission of electrical power, emissions in the value chain of fuels consumed for generating acquired electrical power and supply-linked emissions.
Note 2: Data on work-related travel for 2010 (included under Scope 3) was modified with respect to the data published in CSRR2011 after detecting an irregularity in the consolidation process, quantified with an excess of 8,350 tCO2e, equivalent to a variation of 0.09% over the total figure for Abengoa’s GHG emissions in 2010.
Note 3: Data on supply emissions for 2011 (included under Scope 3) was modified following the detection of an error identified in the Abengoa Bioenergía Agroindustria Agrícola company, whose supply-related emissions as of the 2011 inventory closing totaled 1,809,813 t CO2e, for a total figure of 674,093 t CO2e upon rectification of the error.
GHG emissions reduction
Abengoa encourages all group companies to draw up annual emissions reduction plans. As a result of the proposed emission reduction initiatives, it was estimated that Abengoa would be able to cut CO2 emissions over 1.9 Mt in 2012, in comparison to the 2011 GHG Inventory, with the calculation based on Abengoa company activity parameters.
Taken into account in carrying out emissions accounting was activity type, a factor that has a significant distorting effect on the results. Thus, a company whose activity witnessed a year-on-year increase will also see a rise in its emission levels. For this reason, success in fulfilling reduction plans lies in ensuring that the rise in emissions stays below the activity increase.
In order to eliminate this distorting effect, Abengoa does not compare emissions from one year with respect to the previous year, but rather compares ratios: tons of CO2/activity.

Listed below are highlights from among the initiatives undertaken in 2012 with the aim of reducing the carbon footprint:
- Capture of CO2 emitted during the production process for sale to other businesses. This resulted in the capture of 144,000 t of CO2 at the Abengoa Bioenergy plant in the Netherlands that were subsequently sold to Dutch greenhouse operators.
- Substitution of coke 5 as a reducing agent for charcoal in industrial zinc recovery processes at the Befesa Zinc Freiberg plant in Germany. This initiative led to a reduction of 1,370 tCO2.
- Regulating boiler pressure according to operation level for bioethanol production processes, thereby enabling a reduction in the amount of fuel used at the Bioetanol Galicia plant in Spain. This initiative led to a reduction of 851 tCO2.
In addition, CO2 labels were calculated and prepared for seventeen products and services6 over the course of the year.
Note 5: Solid fossil fuel.
Note 6: More information can be found in the chapter devoted to customers.
Photograph taken by Antonio Cubero Buitrago for the IV edition of the photography competition on sustainable development.
© 2012 Abengoa. All rights reserved